Harvest Mania

Brief

Playful exploration of autopilot for farming

Platforms

Web (Flash), trade show kiosk

Client

Land-Data Eurosoft

What I did

I worked as a solo dev that translated the client’s vision into the finished game:

A harvesting simulator of sorts where the client’s products support gameplay and, by extension, improve the “productivity” — Gamification in an actually integrated way.

  • Developed the game design, visual design, and created all art assets. (The audio was outsourced.)
  • Programmed everything in ActionScript 3.
  • Created a trade show-friendly version that supported Nintendo Wiimote, showcased on the AGRITECHNICA.

Before Gameplay

Autopilot Appreciation

The game is a harvesting simulator... before the simulator trend was a thing.

Start with Manual Driving...

  • The driving intentionally uses manual controls to feel grounded and provide a baseline challenge.
  • Driving over already harvested areas produces redundant coverage, which is considered wasted work that should be minimized.
  • Besides covering the field, the actual throughput is also influenced by how well the speed matches the organic irregularities of the field.
  • Doing both well at the same time is not easy!
  • On top of it, the driver’s energy level is also a relevant, visible metric. Driving is tiring.

...so Autopilot Can Shine

  • The advertised product actually reduces the effort of steering and redundant coverage, thereby allowing the player to better focus on matching the speed to the field.
  • Instead of pushing the product on the player, the autopilot is offered as a desirable power-up that has to be earned — by accumulating crops — designed to increase its perceived value.
  • This setup also frames the product as an investment.

What Gets Measured Gets Improved

The Performance Graph

  • The machine utilization (y-axis) over time (x-axis) shows how much of the cutter was actually cutting crop (higher is better).
  • The golden shades denote the crop throughput on the speed match.
  • Red shows the wasted, redundant coverage.
  • The navy blue line shows the energy level of the driver.
  • Above the graph, a bright yellow bar shows when the autopilot feature was active.

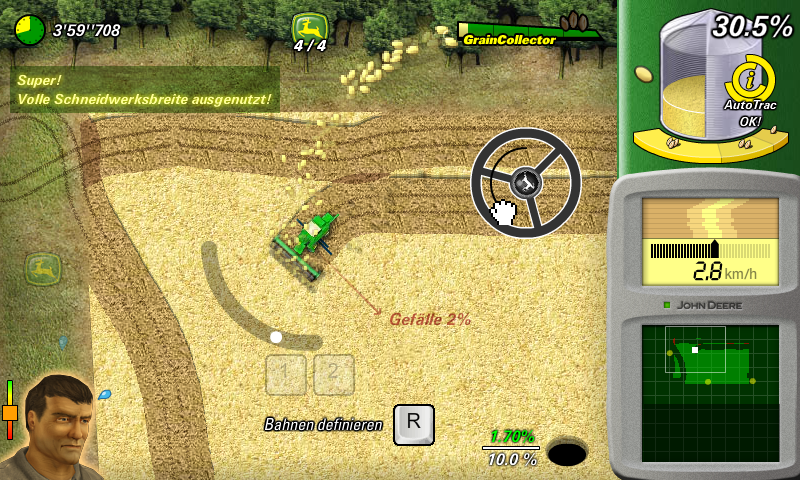
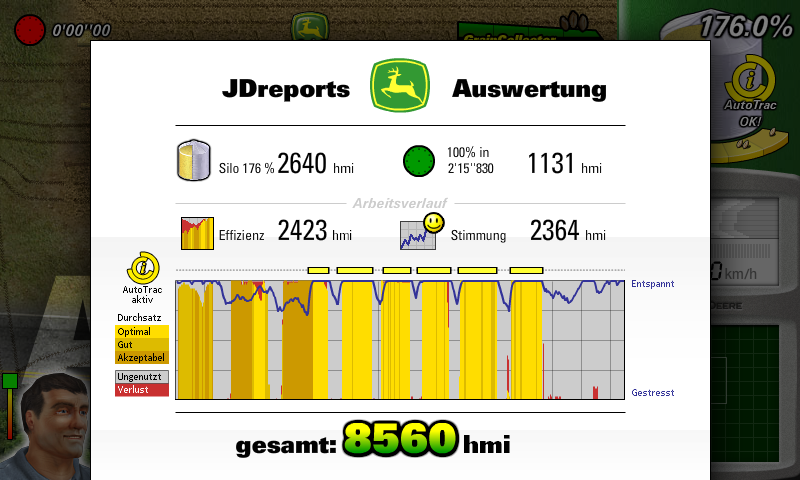
As better crop throughput and lower stress coincide with the autopilot phases, the product benefit experienced during play is also reflected in data.
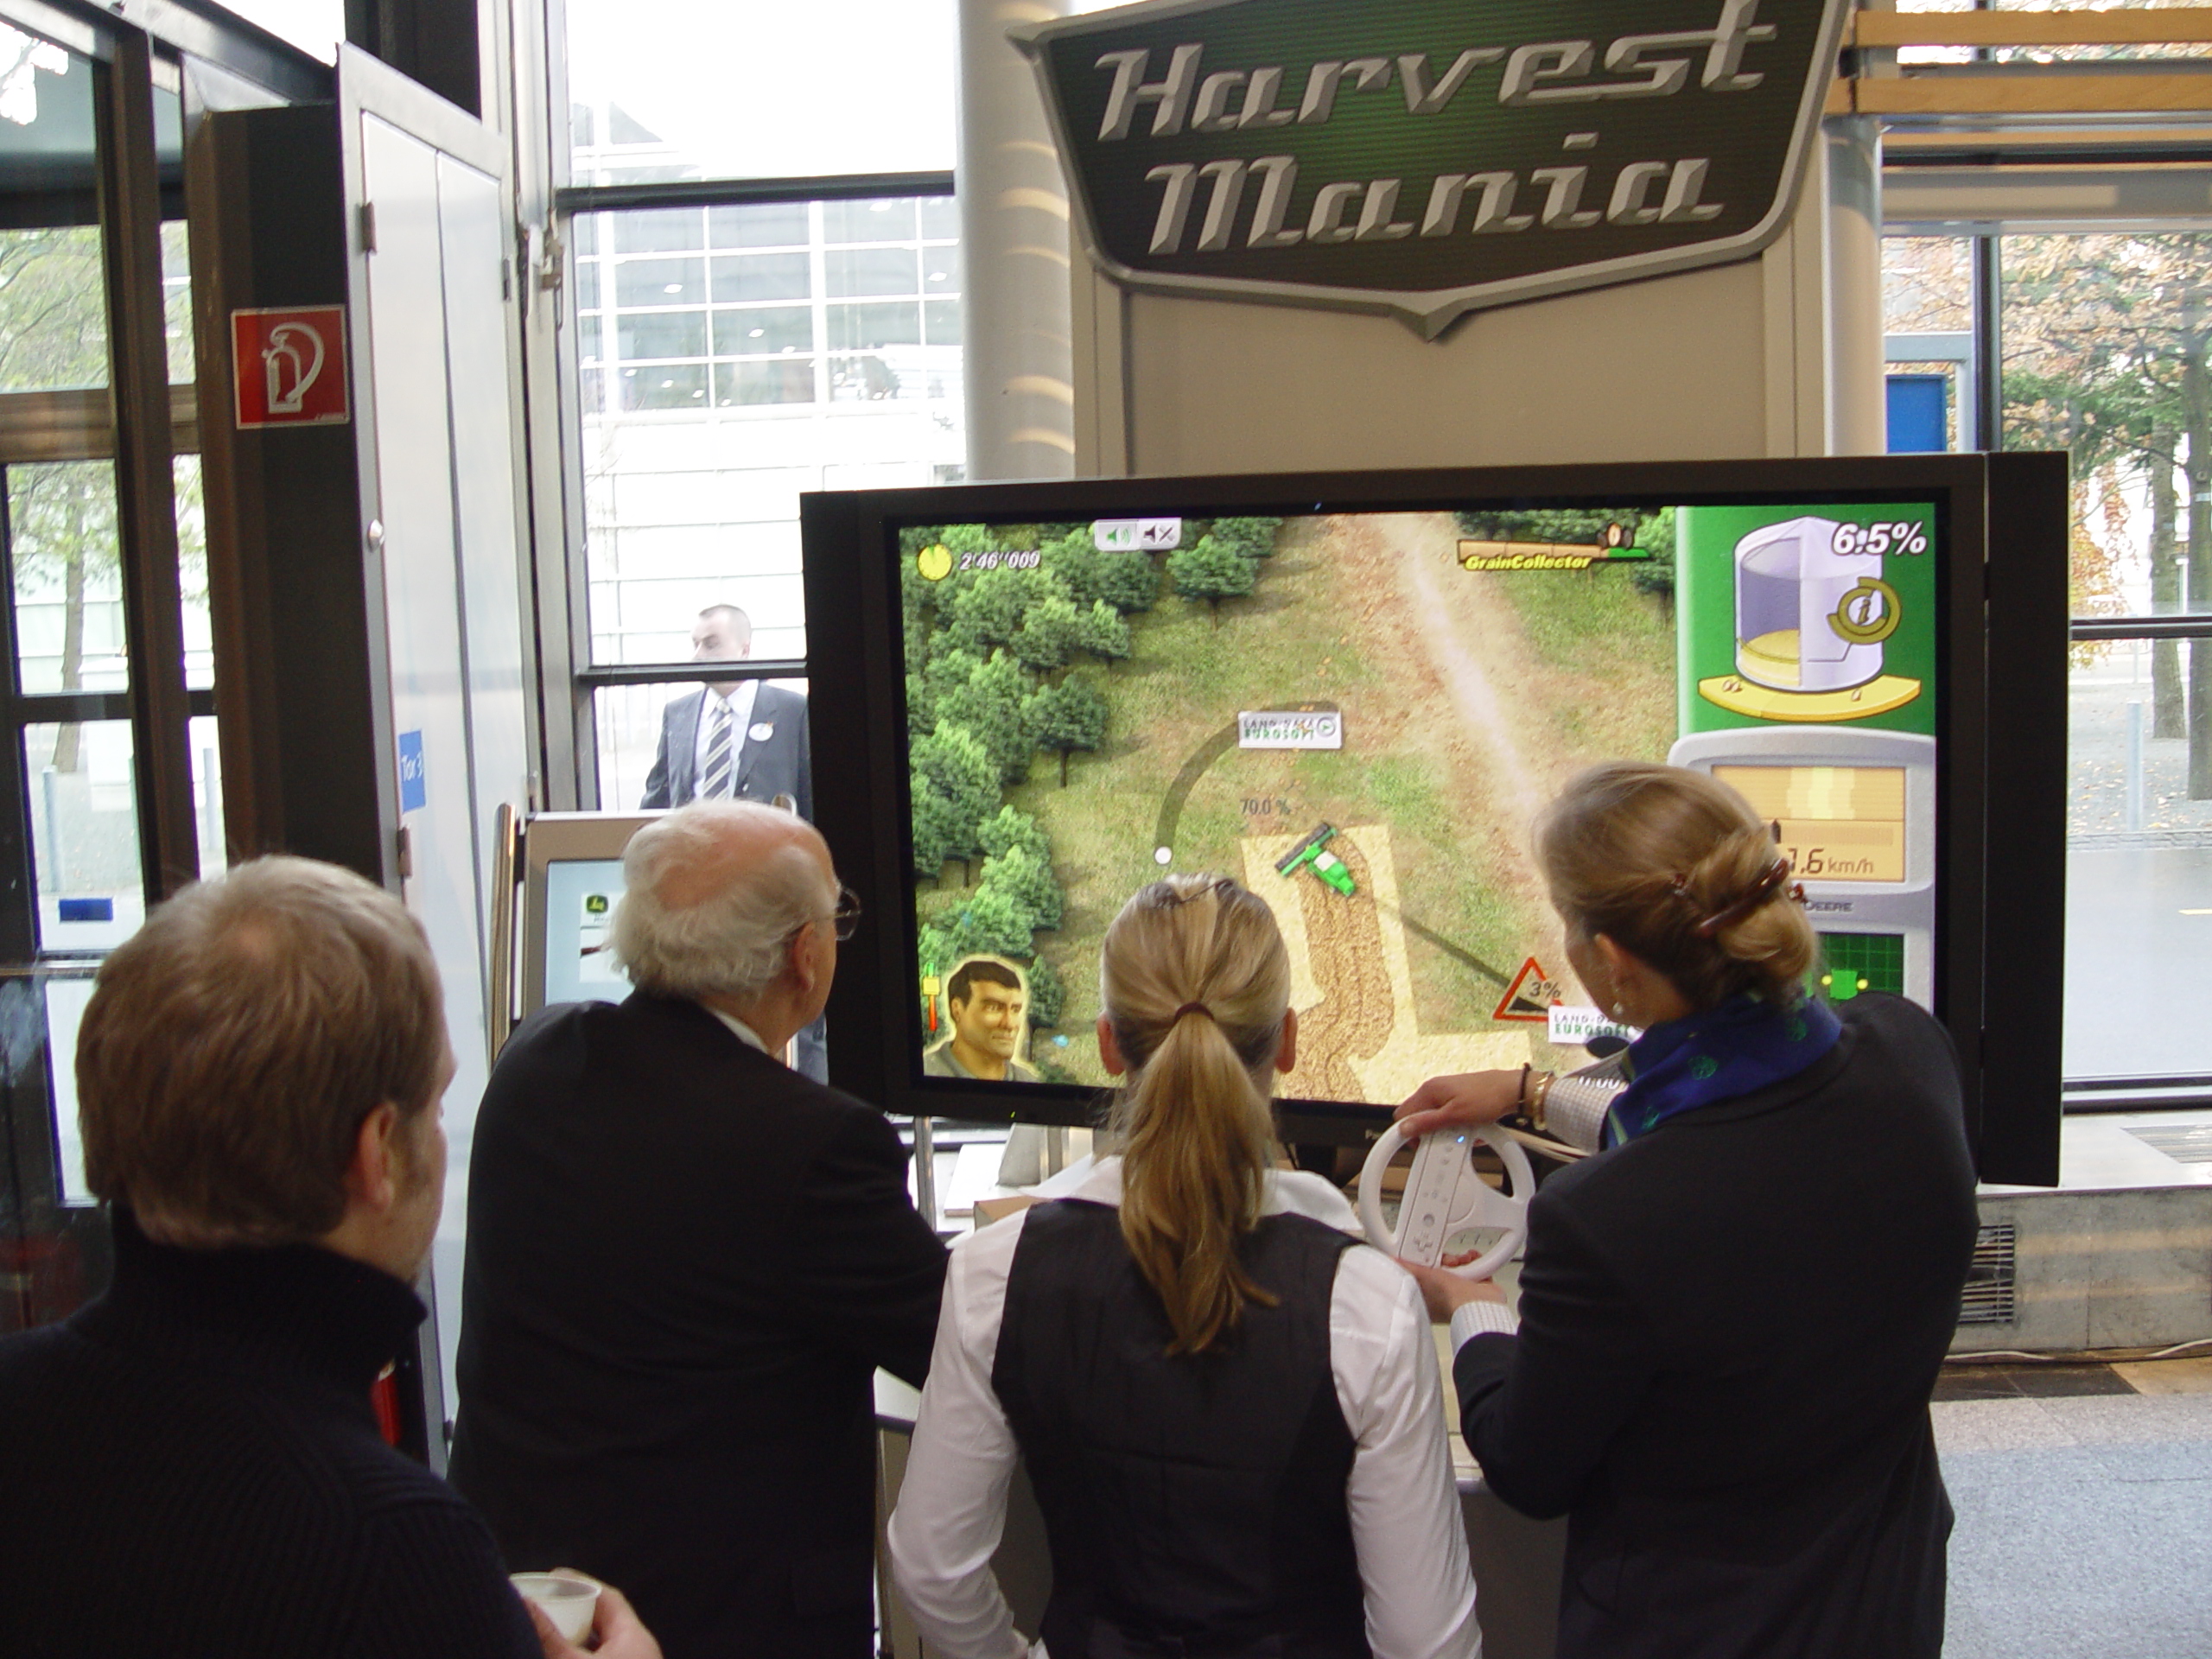